YANG Ming-lun,SHAO Hua
( School of Mechanical Engineering,Shanghai Jiao Tong University,Shanghai 200240,China) Abstract: For the non-stationary characteristics of acoustic emission signals in face milling process,a new approach based on ensemble empirical mode decomposition ( EEM D ) and
IM F energy distribution w as proposed to achieve the detection and identification of tool breakage in milling process. First,EEM D w as used on the original signal to extract intrinsic mode functions ( IM Fs) ,and then IM Fs energy distri- bution w as calculated to obtain the feature vector
and a mathematical model w as established to express the relationship betw een the feature vector and cutter conditions.
Extensive experiments w ere performed to confirm the effectiveness and robustness of the detective method for steady
milling and variable cutting parameters. The results show ed that this method could accurately and stably identify the
tool breakage. Key words: tool condition monitoring ; acoustic emission; ensemble empirical mode decomposition
( EE- M D) ; IM F energy distribution
Real-time monitoring of tool condition for improving production efficiency rate, low production cost, production automation and product quality assurance play an important role. Cutting tool breakage as a main tool failure form, has been the hot topics in the study of international scholars. Mesh before on the knife has broken damage monitoring research mainly revolves around two aspects, one is the sensor technology, the second is technology signal. Many years, with the development of sensor technology is not broken, the different types of sensors are used in tool condition monitoring on the surface (1), such as force sensing device (2), power transmitting device (3), sound shot (4) and sensor etc. In many sensors, acoustic emission sensors sensitivity is high, strong resistance to interference, such as to and economic point [5], gradually been adopted by researchers from all over the world. A variety of signal processing and feature extraction technology was developed and applied to the monitoring system, from the early time domain characteristics analysis [6], the period based on Fourier transform in time-frequency domain characteristics analysis [7], and to the development of wavelet analysis technique developed in recent years of tool breakage monitoring plays a role in promoting. For tool breakage in milling process, monitoring, however, didn't have a very good solution method, the reason mainly lies in two aspects: first, in milling, a cutting parameter change will impact on signal processing technology of the qualitative; Secondly, the milling process of AE signal table is now out of the strong nonlinear and non-stationary, the nonstationarity can result in AE signal frequency domain characteristics and subject to change with the passage of time, no method with fixed frequency domain features of milling AE signal
By the test modal solution (empirical mode decomposition, the EMD) is a kind of adaptive based on instantaneous frequency, non linear system and a stable of non-stationary signal processing method of [9]. The original signal by EMD decomposition signal into a set of components, the orthogonal component of the signal, is defined as the intrinsic mode function (IMF). The modular function can describe the inner character of the original signal, can play the role of identification of the original signal. For milling the AE signal, the disadvantages of traditional empirical mode decomposition of the biggest is the modal aliasing problem. According to modal aliasing problem, the noise modal auxiliary experience points (EEMD) is carry out [10], base this besides the influence of the modal aliasing. This paper use the EEMD milling cutter broken damage and AE signals for points, get the intrinsic mode function (IMF), meter to calculate the energy distribution, signal type and eigenvector corresponding relation is established. Further through the system of tests, the test base on EEMD and the energy distribution of damage identification method of cutting parameters is effective. 1 based on EEMD and defects, method for identifying the energy distribution of noise and auxiliary helps the empirical mode decomposition (EEMD) is build to disappear in addition to the modal aliasing phenomenon. EEMD principle is simple: (1) the white noise into the original signal (mixed with white noise standard deviation with the original signal in proportion to the standard deviation of 0. 25). (2) application of mixed signal EMD decomposition; (3) the application of different white noise sequence of steps (1) (2); (4) for each order of the IMF, the results of all the decomposition into average, as the final result.
1. 2 IMF Energy distribution
EEMD is equivalent to an adaptive band-pass filter, x (t), the original signal is decomposed into a set of component signals
1. 1 Noise auxiliary empirical mode decomposition (EEMD) N N
x( t) = ∑ci ( t) + rN ( t) = ∑imf1 ( t) + rN ( t)
Empirical mode solution (EMD) is an adaptive filtering process.
i = 1
i = 1
After the EMD decomposition, the original signal is decomposed into some kind of component signals, is defined as the intrinsic mode function (IMF), meet two criteria:
1) throughout the data length, extreme value point number (including the maximum and minimum) equals the number of passing zero or differ at most 1.
(2) in each IMF imfi (t) is the original signal at a particular frequency component, and the residual component rN (t) energy is small, so when calculating the signal total energy can suddenly not plan slightly. The total energy of the original signal can be represented as:
Within the length of the signal as meaning, on the envelope and the envelope mean value must be equal to zero. The EMD can work out the specific process of IMFs Jane
NE = ∫x2 ( t) dt = ∫[ ∑imf ( t) ]2 dt
i = 1
( 1) X (t), for the original signal length is N, respectively by the use of spline curve links local maximum and local minimum, form into the package envelope under attentive u (t) and l (t). Upper and lower envelope contain among them, the original signal can be local average m1 (t) and the difference with the original signal
h1 ( t) :u( t) + l( t)
E = imf2 ( t) dt ( i,1,…,N)
All of the IMFs are approximate orthogonal to each other:
∫imfi ( t) * imfi ( t) dt ≈ 0 ( i ≠ j)
Calculate the original signal in each adaptive frequency energy points on the cloth, and then define the signal frequency - energy distribution state vector:
m1 ( t) =2 h1 ( t) = x( t) - m1 ( t)
δI = Ei ,i = 1,…N; ? = { δ ,δ ,…,δ }
E 1 2 N
( 2) If h1 (t) meet the intrinsic mode function of the two definition, then h1 (t) is the first order of the IMF. Otherwise, replace the original signal with h1 (t) x (t), to the screening process, calculate the h1 (t) of the upper and lower envelope (u1 (t), l1 (t)) and calculate the local mean value and the difference of h1 (t) :
u1 ( t) + l1 ( t)
When cutting condition change, changing parameters such as cutting tool breakage suddenly, cut cut or other factors, the energy distribution and state vector ? will produce some change at the same time. In order to quantitatively describe the cutting condition, Δ ? (t) and the delta Max (t) was introduced to represent the change of cutting process:
m11 ( t) =h11 ( t) = h1 ( t) - m11 ( t)
Δ?( t) = { Δδ ( t) ,Δδ ( t) ,…,Δδ ( t) } ( i = 1,…,N)
( 3) When adjacent two screening results of the standard deviation (SD) reduce below the set threshold, can obtain an IMF, general standard deviation threshold is 0. 2 ~ 0. 3. Under normal circumstances, in order to get a first order the IMF needs to be k times screening process:
c1 ( t) = h1k ( t) = h1( k -1) ( t) - m1k ( t)
( 4) In the first order after the IMF is broken out, the original signal x (t) and c2 (t) difference as the new original signal, are in accordance with the standards of the same weight after screening process until all of the IMF. When the first order N IMFcN residual component an rN (t) (t), or fall by more than set threshold, or the residual weight function rN (t) becomes monotone function, screening process to stop.
N
x( t) = ∑ci ( t) + rN ( t)
i = 1
Although the EMD decomposition is an effective tool for non-stationary signal processing, but still exist some shortcomings of traditional algorithm. For milling cutting AE signal, the modal aliasing effect is most serious. Modal aliasing is defined as: first order the IMF contains multiple time scales, or a time scale without and points, and with the IMF. Take this a to g
Δδi ( t) = δi ( t) - δi ( t0 )
Δδmax ( t) = MAX{ δ1 ( t) ,δ2 ( t) ,…,δN ( t) }
2 Identification method of the application
2. 1 Test system and test design
Test system as shown in figure 2, the milling test made in DMG DMU70 five axis vertical machining upper-middle, sensor with rich men made ceramic company FUJICERA 1045 s wide belt type hair shoot sensing device, preamplifier magnification is 40 db, work pieces of 45 # steel, size of 50 * 50 * 400 mm. Sensor after daub of coupling agent, through magnetic adsorption device is fixed at the end of the artifact, as shown in figure 2. The sensor output signal after a preamplifier, was sent to the number according to the mining set card (ADLINK PCI9816), 5 MHZ sampling frequency, after kept by NI LABVIEW platform - based data acquisition process sequence in the sciences, stored in binary format. Preserved the original signal, after 20 KHZ high pass filtering to the data processing program based on MATLAB platform for reprocessing.
In order to study the effects of milling parameters change on recognition method, shown in figure 2 milling experiment was carried out on test system, test conditions, such as table 1. In order to obtain stable cutting tool breakage suddenly in the process of signal, the diameter of 0. 5 mm of carbide drill 45 # steel inlaid into the internal matrix, and the formation of hard spots, broken damage happened when cutting tool contact hard points, as shown in figure 2, test conditions, such as in table 2.
Table 1 single factor milling experiment design
2. 2 Based on the energy distribution of damage signal feature recognition
Empirical mode decomposition is equivalent to an adaptive filter group (11), the original signal after EEMD decomposition, the formation of multistage intrinsic mode function, module and function of each step is within the scope of the original signal at a particular frequency component. Because each component of the signal between orthogonal to each other, and each order the IMF's energy came from the original signal, so all the component of the signal energy sum equal to the original signal (12), the intrinsic mode function to adaptive reflect the energy distribution of the original signal frequency - energy state. Milling has the very strong nonstationarity, AE signal by using the energy distribution can effectively reveal the original signal intrinsic characteristics, extract the signal feature vector.
Figure 1 to stabilize the cutting tool breakage suddenly signal in time domain wave form of a graph. Can be seen from the waveform diagram, stable cutting tool break loss of signal is divided into three parts: in the process of stable cutting, tool breakage and damaged knife cutting. New tools to AE signals generated by cutting the workpiece stability is high, less abrupt type letter number, signal amplitude is lower; Knife with have broken loss, cutting tool geometry change of fracture can instantly release, can produce quantity is very large, high amplitude of signal, signal stability is poor, decay very fast; Tool cutting workpiece after broken damage of stability with a new sword of AE signal amplitude is higher and then breaking type signal. This is the knife blade geometry change, surface geometric shape is irregular, knives
And artifacts caused by the contact area increases.


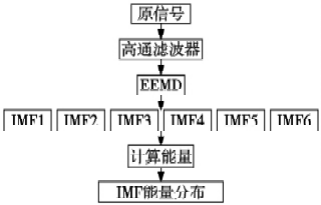
Figure 1 algorithm block diagram
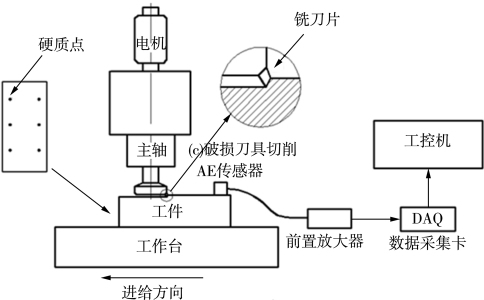

Figure 2 test system
Take respectively0. 008 - 0. 018s,0. 0244 - 0. 0264s,
0. 035-0. 045 s three time segment is analyzed. Figure 4 represents the stable cutting letter, tool breakage signals, and damaged knives cutting signal power spectrum. As can be seen from the power spectrum, stable cutting and broken damage has cut cut AE signal main energy is concentrated in 30 ~ 50 KHZ area, and relative to the stable cutting, damaged knives cutting signal energy is large, high content of high frequency components. Tool breakage signal main energy is concentrated in the 100 ~ 400 KHZ area, energy is much higher than the milling signal. But just from the energy size of identification of tool breakage is not accurate, because of the effect of the change of cutting parameters could sharply AE signal energy, and therefore need to shown in figure 4 characteristics of mathematical modeling. Figure 5 for the three sections of signal EEMD IMFs component signals were decomposed respectively, can be seen from the diagram, the tool breakage signal main energy is concentrated in the order 1, 2, 3 on the IMF, and stable cutting signal main energy is concentrated in step 3 and 4 of the IMF. For tool cutting, damaged order 1, 2, the IMF is isolated from the main type of random sudden signal, but is still the main energy focused on the 4th order of the IMF. Application in the previous section, carry out the energy distribution algorithm calculated the energy, get the IMF energy percentage of the three sections of signals, the values shown in table 3. On the basis of this painting make the IMF energy distribution curve, as shown in figure 6.


In figure 3 stable cutting tool breakage
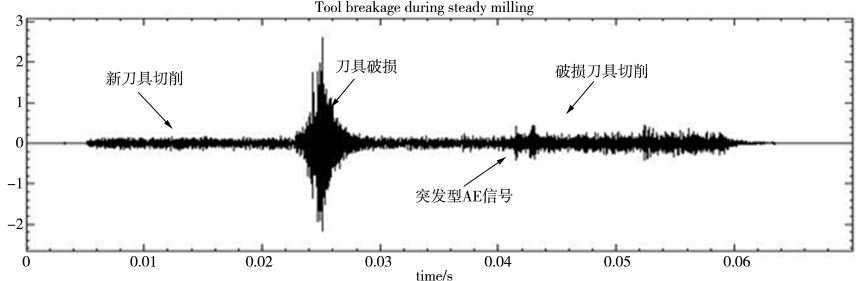

Figure 4 signal power spectrum


Figure 5 intrinsic mode function group
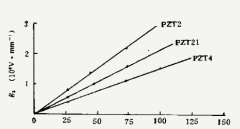
Energy distribution acquisition signal extracted from the IMF, draw curve, as shown in figure 7, 8,9
Can get a conclusion from figure 7, cut cut rate will not change the energy distribution state, also will not change the distribution curve of peak, in figure 8, 9, also be able to get the same conclusion, to sum up, the change of cutting parameters will not make the IMF produces mobile energy distribution curve peak position, only the tool breakage can make it from order mobile 4 to 7, the energy distribution curve peak in the fourth order at the IMF, the signal main energy is set in the fourth order on the surface, the knife has broken damage of the curve of the signal peak appears in the third order of the IMF. The main energy concentrated in the third order the IMF. From the Angle of the general don't degrees, when cutting tool breakage occurs, the distribution curve of peak from the fourth order to move to step 3. Through extracting the energy distribution curve of the peak position, but as an associate from identify tool breakage in milling signal, signal of real knife has now broken damage monitoring.
2. 3 The influence of variable cutting parameters
Cutting parameters in milling process is often have change, but the change of the cutting parameters will have obvious effect of the AE signal, so must recognition method is not sensitive to the change of cutting parameters, can only get pushed in fact should be used widely. Needle of cutting speed, cutting depth and feed rate of the three parameters, the single factor experiment was carried out respectively, for each kind of cutting parameters
Step 3. By monitoring curve peak position to identify tool worn loss of signal, a large number of experiments show that the recognition method can eliminate the interference of cutting parameters, accurate identification of tool breakage.
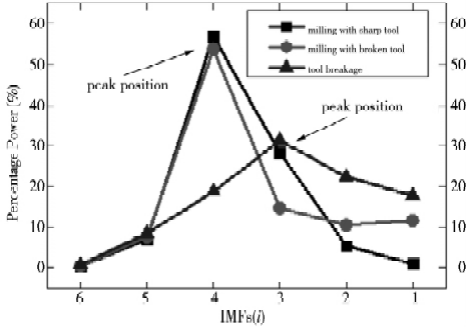

Figure 6 the IMF energy distribution curve
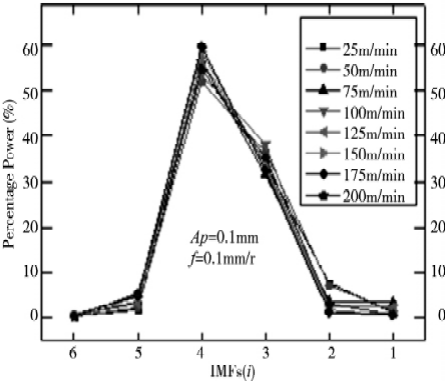
Figure 7 cutting speed


Figure 8 cutting depth
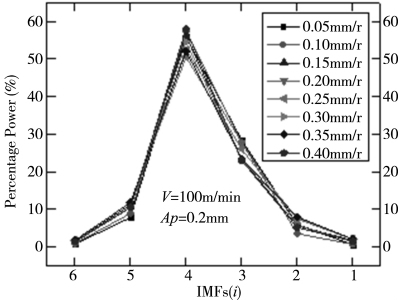

Figure 9 variable feed rate
Component proportion is low; Damaged knives cutting signal amplitude is higher, and is accompanied by low-rising value type emergency signal, signal stability, and high frequency component proportion relatively stable cutting signal was increased; Tool breakage signal energy, the largest proportion of high frequency component is much higher than the milling signal.
(3) milling signal the IMF distribution curve peak is located in the 4th order, tool breakage signal curve peak is located in the stage 3.
(4) the cutting speed, cutting depth and feed rate doesn't make the distribution curve peak moving, only tool breakage can affect the IMF points cloth energy state.
(5) in the process of milling, by monitoring the peak value of the AE signal energy distribution curve move, can effectively identify tool breakage.
〔reference〕
〔1〕Zhu Kunpeng,Wong Yoke San,Hong Geok Soon,“Wavelet
analysis of sensor signals for tool condition monitoring: A re- view and some new results ”,International Journal of Ma- chine Tools & Manufacture,2009( 49) : 537 - 553.
〔2〕 H. ShaoH. L. WangX. M. Zhao,“A cutting power model for tool wear monitoring in milling ”,
International Journal of Machine Tools & Manufacture,2004 ( 44 ) : 1503- 1509.
〔3〕 H. ShaoX. H. Shi,“Power signal separation in milling process based on wavelet transform and independent
compo- nent analysis ”,International Journal of Machine Tools & Manufacture,2011( 51) : 701 - 710.
〔4〕 Xiaozhi Chen,Beizhi Li,“Acoustic emission method for tool condition monitoring based on wavelet analysis”,Advanced Manufacture Technology,2007( 33) : 968 - 976.
〔5〕 K. Jemielniak,P. J. Arrazola,“Application of AE and cut- ting force signals in tool condition monitoring in micro-mill- ing”,CIRP Journal of Manufacturing Science and Technolo- gy,2008( 1) : 97 - 102.
〔6〕 K. Jemielniak,O. Otman,“Tool failure detection based on analysis of acoustic emission signals”,Journal of Materials Processing Technology,1998( 76) : 192 - 197.
〔7〕 YonghongPeng, “Empirical Mode Decomposition Based Time-Frequency Analysis for the Effective Detection of Tool Breakage”,Transactions of the ASME,2006,128( 12) .
〔8〕 K. P. Zhu,Y. S. WongG. S. Hong,“Wavelet analysis of sensor signals for tool condition monitoring: a review and some new results”,International Journal of Machine Tools & Manufacture,2009( 49) : 537 - 553.
〔9〕 Huang,N. ,Shen,Z. ,Long,S. ,et al. ,1998,“The Em- pirical Model Decomposition and the Hilbert Spectrum
Cutting parameters based on milling process change and milling AE signal not stable point, this paper puts forward a new kind of tool breakage recognition based on EEMD and IMF energy distribution method, this method can adaptive should be delivered the original signal points of cost function, and through the calculation of the energy of the IMF, depicting the original signal frequency rate - the amount to the state. To extract the energy normalized processing, draw the distribution curve, by judging the peak position to identify the occurrence of tool breakage. Further, through a large number of experiments to verify the identification methods for the effectiveness of variable cutting parameters of the cutting process. To sum up, the main conclusions of this paper as follows:
(1) the milling the signal main energy is concentrated in 30 ~ 50 KHZ range, tool breakage signal energy mainly concentrated in the range of 100 ~ 400 KHZ.
(2) stable cutting signal amplitude is low, less sudden hair signal, high frequency
Nonlinear and Non-Stationary Time Series Analysis”,Proc. R. Soc. London,Ser. A,454: 903 - 995.
〔10〕 Wu,Z. H. ,Huang,N. E. ,2009. “Ensemble empirical mode decomposition: a noise-assisted data analysis meth- od”. Advances in Adaptive Data Analysis 1( 1) : 1 - 41.
〔11〕 Patrick Flandrin,“Empirical Mode Decomposition as a Fil- ter Bank ”, IEEE SIGNAL PROCESSING LETTERS,
VOL. 11,NO. 2,FEBRUARY 2004.
〔12〕 P. Flandrin,P. Gonc-alve’s,G. Rilling,“EMD equiva- lent filter Banks,from interpretation to applications”,In: N. E. Huang,S. S. P. Shen ( Eds. ) Hilbert_Huang Transform: Introduction and Applications,World Scientific,Singapore,67 - 87,360.


 Blog
Blog