1 the introduction
Steel truss is an important basic structure of the bridge and a variety of buildings. The steel truss structure subjected to cyclic load fatigue crack formation and propagation in is of great significance to ensure transportation safety.
In the past for the welding of steel structure of bridge truss adopt comprehensive detection, such as visual and strain gauge measurement, etc. These methods are difficult to find local failure of early cracks and extensive damage before. X-ray, ultrasound and other technologies are also difficult to provide the continuous monitoring of the whole structure, the acoustic emission (AE) is the internal source material in the result of the energy release sharply instantaneous elastic wave phenomenon, the elastic wave can be placed in special sensors to detect the component surface. By AE technology to monitor the crack or defect in the component is active, so AE signal can reflect and internal dynamic process of local damage on structure. In recent years, AE technology has become increasingly perfect, has been able to provide the continuous monitoring of the whole structure, and according to the received AE signals of sound source localization [1-3]. But, at the different stages of the identification of crack formation and propagation of different AE signal characteristics, and according to the characters of AE signal to assess the severity of crack damage still need further research.
In this study, the AE technology continuous monitoring of web steel truss under cyclic shear loading fatigue crack, the acoustic emission characteristics of three phase truss fatigue process curve. Based on fracture mechanics and the experimental results, this paper proposes a ringing count rate d eta/dn and the relation between crack growth rate da/dn, used to describe the web steel truss during fatigue crack stable propagation characteristics of acoustic emission signals.
2 experimental process
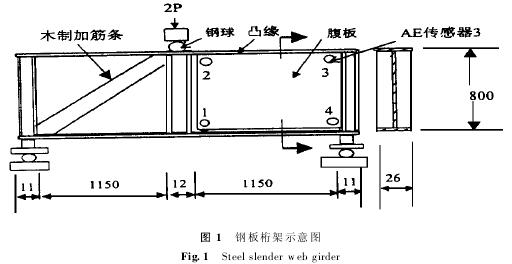
Fatigue test at the university of Wales Dartec fatigue test machine of 500. The truss by the slot at the bottom of the backup roll bearing, truss top center in the form of sine under dynamic load, the load frequency of 1.5 Hz. The load mechanism through a big ball of truss applied scope of 10 to 270 kN load. Truss of geometric shape and size (mm) as shown in figure 1, other parameters: the web, the thickness of 6.17 mm, young's modulus was of 66.33 kN /, 398.90 N/was tensile strength; Flange plate, 10.53 mm thickness, young's modulus was of 69.87 kN /, tensile strength of 480.00 N/was. Using Locan 320 acoustic emission detection system truss fatigue process and to collect AE signal. This system includes a main computer, four data acquisition boards, four R15IAE sensor and preamplifier combined into an organic whole, the four sensors with Dow Corning Hangdsil silicone glue on the right side on the web, its position as shown in figure 1 of 1, 2, 3, 4. The threshold and gain 45 dB and 20 dB respectively. Once beyond the threshold, the main parameters in the AE signal was system, measure and record, then measured data are fed into a computer system storage, for drawing or to call in the data processing and analysis.
Sound source localization by Locan 320 system automatically, using two-dimensional rectangular AE source locating method, any cycle of AE source location can be displayed on the screen in a timely manner.
, in the process of truss fatigue cracks can be visual or two on the right web. In a 2138970 - cycle, visual inspection for the first time to the first crack. When the crack length of more than 275 mm, the crack. The focus of this study is the first in the acoustic emission features of the crack initiation and growth, so only the AE signal from the first crack is what we are looking forward to, the second crack of AE signals and other noise must be clear. Noise signal including the interference of acoustic emission system sound signal amplitude (generally less than 20 db), by mechanical loading, which is generated by the relative motion of the mechanical noise along the slower (up) and the grinding crack closure. To eliminate the first crack outside of acoustic emission signals, and crack closure of friction noise, here have adopted two kinds of special filtering methods:
(1) space differential method, namely through visual inspection method on the specimen set a contains only the first crack area, all from the reserved area of AE signal, the clear signal of the data in other areas.
(2) the load identification method, each cycle is divided into high load half cycle and low load half cycle of two parts. Roughly speaking, the expansion of the fatigue cracks tend to occur in high load half a cycle, and part of crack closure in the half cycle of low load, and friction due to the crack surface grinding noise. So just remove low load data in a half cycle can eliminate friction noise.
Experiments and with visual method for monitoring fatigue crack and timing shutdown, measure and record the crack length and position.
3 the result of the experiment and analysis
First crack occurred in the central steel truss web plate on the right side close to the position of the top flange. Crack first between web and flange welding with toe to form, where the stress concentration due to uneven thickness.
In web formed on one side of the crack in the extension of penetration along the thickness direction at the same time, until she reached the other side. In
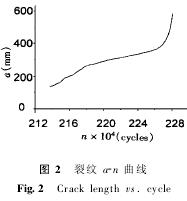
2138970 - cycle when the crack runs through web become visible cracks, at this point in the amount of the first side crack length 135 mm, and crack down the connection of web and flange welding belt along the direction of the crack to expand at both ends. In a 2192470 - cycle when the crack length of 275 mm, the crack growth direction changes, to internal web extension, moreover also observed truss vertical deformation increased and the crack surface plate tearing phenomenon. These two phenomenon worsens the crack propagation rate and led to the rapid extension of crack. At this stage of crack propagation can be observed in three modes (open type, shear and tear type). In 2283470 - cycle, crack length is 585 mm, truss deformation is quite significant, cannot safely continue to experiment, the experiment stopped. The first crack length a of cycle number n curve is shown in figure 2.
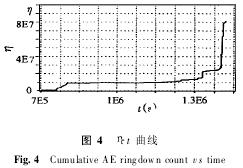
Crack occurrence and expansion of the acoustic emission during H by AE parameters, and eta to describe. Figure 3 a and 4, respectively H -t curve and eta -t curve, figure 3 b said Δ H/Δ Bin -t curve. Here, the eta - cumulative AE ringing count, ringing count is defined as the number of threshold voltage waveform beyond preset. H - cumulative AE hit count, if a sudden type of AE waveform than the preset threshold voltage, referred to as a collision. Hit count is defined as the number of AE hit sensor, in this work, H is AE crash sensor 3 times; Δ H/Δ Bin - AE hit rate, defined as the number of AE hit in a per Bin. In this work, 1 Bin represents 0.6 x 10⁴ circulation. Similarly can define Δ eta/Δ Bin. T (s) - time.
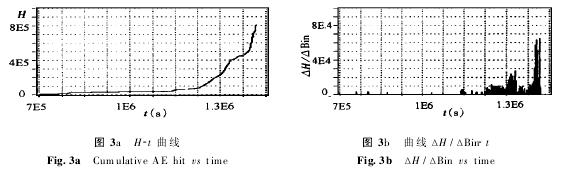
Comparison of crack growth curve (figure 2) and the AE parameters curve (FIG. 3-4), it can be seen that the fatigue crack growth process can be divided into three stages:
(1) the fatigue crack occurred. In 1.3 x 10⁶ - cycle (0.86 x 10⁶ s) near the AE activity significantly suddenly, characterized by H and eta value increases and the Δ H/Δ Bin -t curve appears on the AE pulse. This marks a fatigue crack formation. The climax of AE activity followed by low water of AE activity, AE events until 1.78 x 10⁶ cycles before entering the orgasm, AE activity relatively quiet.
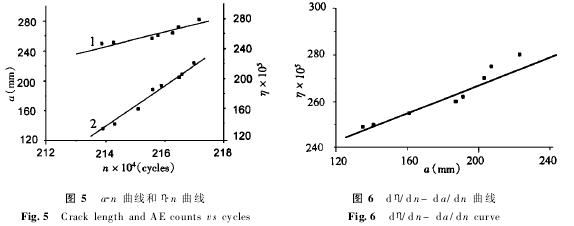
(2) crack penetration throughout the web and the stability of crack extension stages. From 1.78 to 2138970 x 106 cycles crack penetration phase web cycle. As the crack penetration web AE activity again active, H, eta value stable rise, in Δ H/Δ Bin -t curve appeared a series of AE pulse high. In a 2138970 - cycle (1.43 x 10⁶ s) crack through the web, then to the ends of stable extension of crack. From 2.139 to 2.171 x 106 x 106 cycles during cycle of a - n curve and eta -n curve is shown in figure 5. In the figure; 1 - d eta/dn material 1.1 x 10² (1 / cycle), 2-0.3 x 10 - da/dn material 2 (mm/cycle). They showed in this stage a and eta at a steady rate of growth, figure 6 shows that the d eta/dn and the relationship between the da/dn can be represented approximately corresponding to sex,
Fitting the experimental curve can get A1 = 0.36 x 10⁵ (1 / mm). In 2192470 - cycle measured crack length is 275 mm,
Crack growth direction is changed, then the relationship between the eta and a more complex, not sexual relationship with lines.
(3) the crack growth spurt to final destruction. In 2.27 x 10⁶ H after cycle (1.51 x 10⁶ s), eta value has increased dramatically, in Δ H/Δ Bin -t curve appeared a series of extremely high pulse. Corresponding to this, crack extension, violent truss bearing capacity decline.
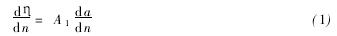
4 fatigue crack propagation model and acoustic emission ringing count rate formula
According to Laird [4] of the fatigue crack growth model, the load caused by atomic plane along the maximum shear stress plane slip, slip crack opening, at the same time also make crack. The crack tip plasticity deformation cause crack tip passivation, and thus increases the surface area of the cracks. In the process of unloading, some of the new crack surface contact, sharp crack. At the completion of a cycle after the crack extension forward a short distance. Set after the cycle number increases Δ n crack extension Δ a (mm), the amount of each cycle of the propagation of the crack for Δ a/Δ n, under the condition of the limit with differential expressed as da/dn, known as the fatigue crack propagation rate. A lot of to describe crack propagation rate and stress intensity factor of the relationship between the experiment curves show that the crack extension stage, stable logdadn online and log often exist linear relationship between Δ (K). At this stage of the Paris [5] suggests a formula:
Δ here K is crack front stress intensity factor range, Δ K = Kmax - Kmin Kmax and Kmin is a cycle of stress intensity factor of the maximum and the minimum b1 and m1 is a material constant.
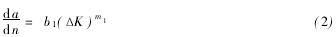
Sinclair [6] formula is established the AE ringing count rate d eta/dn and the relationship between the stress intensity factor range Δ K:
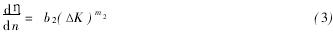
B2 and m2 material constant is determined by the experiment.
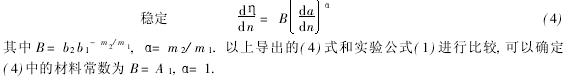
From (2) and (3), we may safely draw the ringing count rate and the relationship between the crack growth rate
5 conclusion
(1) the cyclic shear loading web steel truss of fatigue crack in the connection of web and flange in welding zone of weld toe, and along the border of the web/flange welding with extension. Crack growth is a complicated process, it is accompanied by change in the direction of crack extension, and with multiple failure modes.
(2) visual method can be used to detect crack location, size, growth rate and the failure mode, but unable to detect early crack occurrence and crack expansion. Acoustic emission technique can continuous monitoring of the whole structure, provide records of structure crack in all life activities.
(3) the AE technique is sensitive to changes sound internal microstructure, the fatigue crack occurs, the stability of crack extension and crack growth sharply in the three stages of a large number of AE events occur and can be AE technology to detect. In Δ H/Δ Bin -t curve, the AE pulse of low intensity, high intensity of AE pulse and higher intensity of a series of pulses correspond to the above three stages respectively.
(4) on the stability of crack extension stage, AE ringing count rate and crack growth rate, there is a linear relationship between.
The authors thank the university of Wales F.W.W alliams professors and A.W.D avies Mr Support to this study.
References (abbreviated)


 Blog
Blog