Fatigue damage and the damage characteristics of real_time monitoring on the properties of materials research, quality evaluation has important significance for structure design and components and Acoustic Emission (& Emission AE) as a dynamic nondestructive testing technology, it has the characteristics of continuous and overall monitoring, has become the evaluation of structural integrity and an important means of analysis of structural failure process.
This study applies multi_channel acoustic emission instrument monitoring Yang flower welding beam frame simulation for high speed passenger car steering (hereinafter referred to as welded beam) the whole process of the fatigue test and got the weld and the stress concentration area crack initiation and propagation of acoustic emission characteristics. In the experiment, not only pay attention to the crack formation and propagation of the difference of the acoustic emission signal, but also according to the accumulated acoustic emission ringing count and time (cyclic) relation curve, defines the three welding fatigue damage price section, and based on this, advances the model describing the material fatigue damage, for monitoring in the future high speed passenger car welding experiences for the structural integrity of the architecture.
1 test process
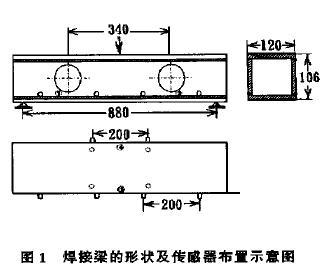
Welding beam in a ratio of 1:3 simulation test for the 250 km/h high speed passenger car bogie side frame beam, its structure is: the four pieces of 12 mm thick of 16 MNR steel compound boxes in the cross section of the form closure straight beam; On the side of the corresponding web site opened two 60 mm diameter hole, used to simulate the stress concentration of the frame beam and side beam connection. Test beam shape, size and the distribution of acoustic emission sensors as shown in figure 1.
Structure under cyclic loading, the damage often occurred in large stress zone and does not involve the entire structure of all materials. Therefore, based on the characteristics of the stress of the welding beam and finite element calculation results, confirm the welding beam stress on larger parts of four and two symmetrical, sorted by size of stress, followed by welding beam slab center section and the bottom of the web before two holes (figure 1 marked the place of 1, 2, 3, 4). For this, will be 10 sensor is divided into four groups, coupled symmetrically on both sides of the high stress area (see figure 1, a. and marked/part). In addition, in order to effectively eliminate the noise in the test, improve test precision, in addition to using line positioning on the software, are still in the experimental beam stress points of the outer layer with soft aluminum sheet of polypropylene cloth, taking advantage of steel acoustic impedance of the different parts to eliminate contact friction noise.
When the fatigue test, using acoustic emission instrument LOCAN - 320 type 12 channel and Philips PM3365A type transient digital storage oscilloscope for acoustic emission monitoring and transient waveform acquisition. Test instrument in the parameter Settings and software function of literature.
2 test results and discussions
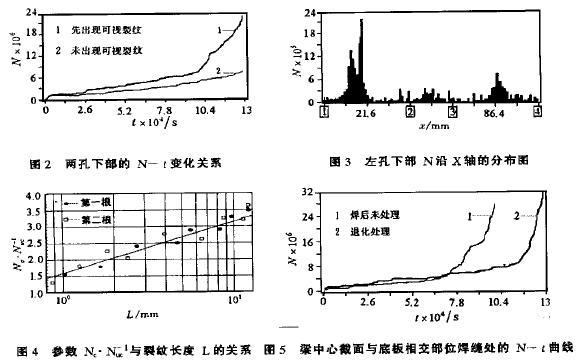
2.1 defect position determination figure 2 for fatigue test process, the welding beam two hole bottom accumulated acoustic emission ringing count the relationship between N and time t (cyclic time N) curve. By figure 2, the accumulation of side hole ring visible cracking count first is always higher than that of no cracks on or later the accumulation of side hole ring count. This shows that under the same test conditions, by comparing the two holes of the distribution of a component in symmetrical bottom ae characteristic parameters, cumulative ringing count change over time, to determine which parts there are serious defects or cracks on first. The criterion of validity has been proved in the experiment. Figure 3 for welding beam bottom left hole appear visible crack before (about 1 mm), the accumulation of monitoring to the ringing count along the X axis (relative position sensor) distribution. From figure 3, the left side of the hole bottom sensor between 1 and 2, the highest accumulated acoustic emission ringing count, in which the fatigue crack on the left side of the hole bottom. The results show that the experiment of defect judgment is accurate. (mem)
In the practical engineering structure, most of the structure has a certain symmetry, such as Bridges, and large construction of roof truss plane. By comparison discriminant method, therefore, some dangerous parts of the structure of the monitoring of practical engineering significance.
2.2 figure 5 fatigue cumulative damage model is without any treatment after welding (curve 1) and (curve 2) treated by annealing process two kinds of welded beam, the accumulation of intersect the beam center section and the bottom seam ringing count (cyclic) change over time of the diagram. Figure 6 as visible cracks appear before cumulative ringing count (relative position sensor) distribution along the X axis, from figure 6, you can see most of the acoustic emission signal from the Central Line positioning, the cracks appear.
Fatigue damage of metal material is dislocation glide - the formation of micro crack fracture, the dynamic process of crack extension - the cumulative damage result reflected in the material itself is the anti_fatigue performance degradation. Baram. J and Rosen M et al. in using acoustic emission technology to material fatigue damage and fracture process after long_term research, think ringing count can well reflect the change of material performance. From them with the materials of the dislocation movement, inclusion of fracture and crack propagation is proportional to the strain energy release.
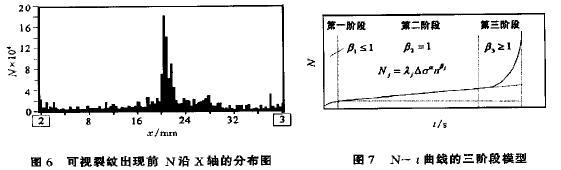
Analysis diagram 2 and figure 5 ringing count the accumulation of N curve along with the change of time t, found that the curve can be divided into three sections. From the perspective of damage mechanics, the three sections of curves can be defined as three stages of material damage occurred. In order to facilitate analysis, will in figure 2 and figure 5 N - t curve model, as shown in figure 7. According to this model, in the form of fatigue cumulative damage curve can be described as:
Below will be based on the analysis of the stages and the damage curve corresponding to the characteristics of acoustic emission signal, find out the reason of causing damage curve shows three stages and each stage of the relationship between:
The first stage for the material initial elastic_plastic deformation stage. The early loading, because of the non_metallic inclusions, fracture and welding slag glue, the acoustic emission source is active, and generate some higher amplitude of the acoustic emission signal, so the damage curve at this stage up relatively quickly. The literature that accounts for only about 5% of the total life expectancy, at this stage it can not be considered.
The second stage is the formation of micro cracks and expansion stage. Micro cracks mainly formed in parent metal and non_metallic inclusions and welding defect. Due to micro cracks formed at the beginning of the stress intensity factor is small, so the local plastic deformation from micro cracks and defects in the acoustic emission signal is weak, and the frequency and amplitude are low, the change is very small, the N - t curve approximation in a straight line.
The third stage is the stage of macroscopic crack formation and propagation. Compared with the second stage, the acoustic emission signal activity have a significant rebound, and there are quite a number of relatively high amplitude of the signal, which means that the formation of macroscopic crack. With the continuous extension of cracks, the occurrence frequency of acoustic emission signal and strength continuously increased, until failure, this phase of the acoustic emission source is mainly the crack tip plasticity deformation, fracture and crack extension of inclusions (including the crack closure signal produced by friction). This stage N - type t curve exponentially increase (B3 > 1), such as the derivation of type (2) to this stage the slope of the curve rate as follows:
At the same cumulative damage curve, the curve in the second phase of the slope is a constant, and in the third phase of the slope that increases with the increase of the n, see type (3). By N - t, therefore, the slope of the curve changes, which can diagnose the damage of components. Curve slope of small changes or for constant, less material damage; When the curve slope gradually increase, material damage is more serious. Comparison and analysis the result of the test table, figure 2 and figure 5 damage curve near the second and third stage a turning point in the corresponding time, appear visible cracks is high beam welding stress time. Therefore, the second phase to the third phase of the transition point on the curve, can be used as under fatigue loading, a sign of macroscopic crack formation.
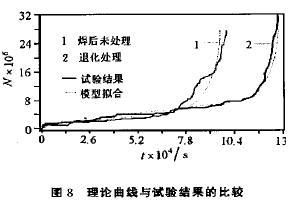
According to the test results shown in figure 5, and to fit the curve of the third stage: for without any treatment after welding beam B3 = 6. 21. After heat treatment of beams B3 = 5.1. Figure 8 for the theoretical curve and the comparison of experimental results. Visible, the proposed damage model can well describe the damage under the action of alternating load of welded beam are studied.
2.3 mother material and weld crack acoustic emission signal differences
Acoustic emission is produced when the materials or structures under external force deformation or fracture, releasing strain energy in the form of elastic wave physical phenomena. Therefore, the different characteristics of acoustic emission signal, reflects the internal damage mechanism of different materials. Figure 9 for the parent metal and weld cracking when the acoustic emission signal amplitude histogram (ringing count). From figure 9, the acoustic emission signal amplitude distribution range is very wide, from 43 db (threshold) to about 80 db, obviously there are two peaks in this distribution. When the parent metal cracking (figure 9 (a)), low amplitude peak at 48 db, high amplitude peak at 75 db, seam cracking (figure 9) (b), low amplitude peak area at 56 db, high amplitude of the peak at 90 db, the peak height and position in figure 9 in essence reflects the fatigue crack and crack and extension, acoustic emission source and signal strength is different. Under the effect of cyclic loading, the fatigue crack formation and extension of the main acoustic emission source for cracking and crack tip deformation of plastic zone of the crack tip. Test found in the parent metal hole cracking and crack propagation of the acoustic emission signal strength is weak, high amplitude of the signal is less, the waveform is shown in figure 10 (a). This is mainly due to the better parent metal toughness, under alternating load, crack propagation of the crack tip material does not exist obvious brittle cracking, only exist alternately slip. The main source of acoustic emission for crack tip deformation of plastic zone. The plastic fatigue fracture process is slow and signal strength is weak and rise for a long time. After comparison, found that welding crack when signal strength is higher than the parent metal hole cracking when the signal strength, and high amplitude of the signal is more, there are two main types of waveform of the records and now, and two kinds of waveform appear alternately, one of the waveform and parent metal cracking is similar; Another wave of high amplitude, rise time is shorter, as shown in figure 10. (b). This mainly is the irregular inclusions in weld is more, these inclusions in fatigue crack growth hindered the plastic deformation of material, cause stress concentration, leading to brittle cracking caused by. The result shows that acoustic emission signal waveform analysis is to know the means of acoustic emission source.

3 conclusion
(1) under the same noise level, by comparing the same component in the changes of the accumulated acoustic emission ringing count can determine the location of the defect and change state.
(2) weld cracking of the acoustic emission signal activity frequency and amplitude are higher than the base cracking of the acoustic emission signal.
(3) the cumulative ringing counts of acoustic emission technique can be used as a description of material fatigue damage parameter, and a description of the parameter set up mathematical model of material fatigue cumulative damage.
(4) of the acoustic emission in transient waveform contains many useful "information", by recording the transient waveform analysis of acoustic emission, can more clearly understand the characteristics of acoustic emission and material changes of the internal structure.
References (abbreviated)


 Blog
Blog