Pick to: to the body structure characterization parameters of acoustic emission data analysis, data processing of statistical model is established, and USES this model to analyze the whole machine fatigue test of a certain plane and a random airborne aircraft in acoustic emission monitoring data, put forward the structural damage criterion, for practical application.
Key words: acoustic emission; Monitoring; Fatigue crack; Mathematical statistics
From the 60 s, acoustic emission technology into the practical phase, the acoustic emission instrument for commercial use. In the field of aviation, due to the deposit
On the special requirements of aircraft structure fatigue crack monitoring, acoustic emission technology also got rapid development. The United States in the field to a lot of work [1], has developed the "flight structure monitoring system (FSMS)" and "flying in the crack detection system (IFCDS)", etc.
For acoustic emission technology research in China since the early 70 s, has achieved a lot of [2], the author's research group for "aircraft structure fatigue crack detection system, and a computer application technology research institute jointly developed PTAE 4 type a [3, 4] airborne acoustic emission monitoring system (hereinafter referred to as acoustic emission system), and the whole machine fatigue test of a certain plane and a random airborne acoustic emission monitoring application research in aircraft.
1 characterization of acoustic emission signals
1.1 event count, event count rate and the total number
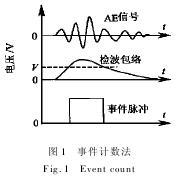
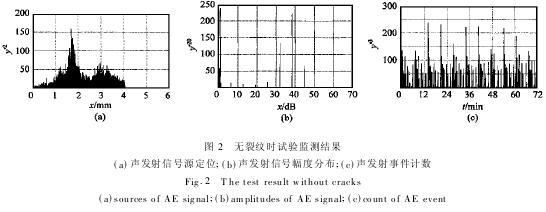
Counting method is a common method of processing the pulse signal. As shown in figure 1 a sudden type acoustic emission signal, after the envelope detection, waveform than the preset threshold voltage (threshold) to form a rectangular pulse. Type a sudden signal to form a rectangular pulse is called an event, counting pulse number is events. Event count per unit time is called event count rate, the accumulation of the event is called event total number. Acoustic emission system, adopting the counting said event count distribution on the relationship between the time (see figure 2 (c)).
1.2 amplitude and amplitude distribution
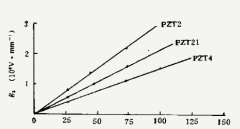
Refers to the peak amplitude of the acoustic emission wave amplitude (Vp), the amplitude distribution is also called the amplitude distribution. Amplitude and amplitude distribution is considered to be more to reflect a processing method of acoustic emission source information, it can be either the counting of amplitude distribution, can also be ringing count of amplitude distribution. Acoustic emission system USES is the former (see figure 2 (b)). In acoustic emission system using the transform it into the dB value

Vp refers to the transducer receives the signal after the preamplifier and main amplifier and gain amplification in sequence, and the threshold value of the output waveform peak, resulting from the plastic unit for mu V.
Test showed that the different distribution of acoustic emission sources have different amplitude spectrum, but the same source of acoustic emission spectrum amplitude distribution with a single, this is an important basis of the data processing model is established in this paper.
1.3 acoustic emission location coordinates
The ultimate goal of acoustic emission detection is to determine the position of the acoustic emission source and evaluate its risk degree, in order to take corresponding measures. In order to measure the scope of a monitored object surface defect position, can be of several piezoelectric transducer according to certain geometric relationships transducer array, ae source location coordinates is refers to the distance from each related transducer acoustic emission sources. The acoustic emission system using the straight-line method, namely decorate two transducer, acoustic emission source must be in the connection of both [5] on a straight line or arc. Acoustic emission source and the relations between the two transducer position as shown in figure 2 (a).
2 acoustic emission signal statistical processing model (mem)
In an experiment by acoustic emission signal data n group (structure crack of monitored area has not yet been measured before and are the noise data), each group includes a number of acoustic emission events, count rate, the total number of events, the amplitude distribution and acoustic emission source location, etc. To facilitate carries on the statistical processing, quantitative research is the difference between signal and noise signal of crack, the specific meaning the following characteristics
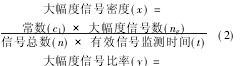

Among them: density said large signal intensity, to avoid its value is too small, in a constant, different monitoring environment, constant values are different; Amplitude is greater than a critical value of Ql signals for significantly, different monitoring environment, Ql values are different; Effective signal monitoring time refers to eliminate downtime, fault and no signal net time after time, calculate accurate to one sampling period; Absolute proportion ratio of large signal. A calculation based on a set of data objects.
Through the n group data according to the type (2), (3) after processing, you get two sets of new data: x1, x2,... , xn and y1, y2,... , yn, each set of data are subject to normal distribution [3], the following group 1 data as an example to show the analysis process:
A random variable x is normal distribution N (ax, sigma 2 x), [6] the distribution density function and distribution function, respectively
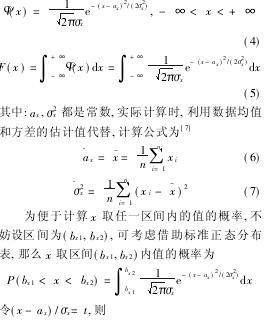

According to type (8), (9) can get criterion: such as probability P value, the density of large signal should be no greater than bx2, ratio should be no greater than by2, otherwise, can think of is not the noise signal, but the crack initiation and extension of the signal. If one of the two out of range, then you can suspect that it is in the critical state (signal source is in a state of transition from a safe state tends to appear defects).
Three statistical processing and analysis of the actual monitoring signal
Use of acoustic emission system of a certain aircraft fatigue test of the machine and existing aircraft ground and flight process monitoring.
3.1 a plane whole machine fatigue test of acoustic emission monitoring
In a plane during the fatigue test machine, the use of acoustic emission system monitoring the machine a portion of the right wing, we obtained 103 groups of data (the equivalent of 1651 ups and downs). Retrieve data before, during and after the crack of the three groups (CL1, Cl2, CL3); Remove the transducer to the crack tip, 1 group (LW) to get the data.
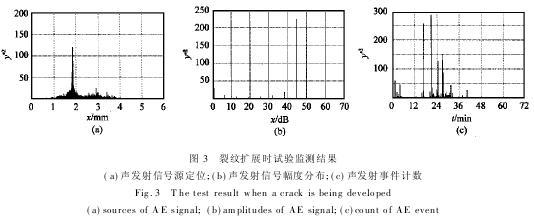
Qualitative analysis is that first 103 groups of data base for test noise signal. After software treatment, several graphical results, select a group as shown in figure 2; Monitoring data processing results of the crack tip is shown in figure 3. By qualitative comparison, on the crack extension figure signal, the signal of counting and there was no significant difference between growth and noise signal, but the large signal number exploding, the proportion is very big, can explain crack signal amplitude is greater than the magnitude of the noise signal.
Take constant c1 for 105, constant c2 is 1, the amplitude threshold Ql is 36 db, according to the type (2), (3), to 60 group after data processing, the calculation results are shown in table 1.
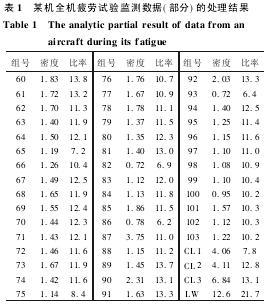
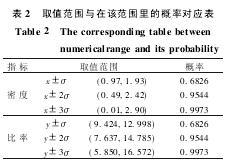
Before 103 sets for the noise signal, the average density of 1.45, the standard deviation was 0.48; The ratio of the average of 11.211, the standard deviation is 1.787. According to the type (8), (9), standard normal distribution table to table 2. [/ mem]
Three groups of data before and after contrast cracks appear, density beyond judgment; Cracks in the data, the density of the signal and ratio are far beyond the range. Thus, criterion of the damage can be concluded that: in a monitoring cycle, if the calculation of the large signal density greater than 2.90, the ratio is greater than 16.572, can be 99.73% probability that happened in the area of the monitoring system of structural damage, should be checked. The criterion is suitable for this system was applied to model the corresponding parts of the actual monitoring.
3.2 a aircraft in the ground state of signal monitoring
In section 3.1, on the basis of experiment and analysis, according to the literature [1], the selection of an aircraft flying around edge of main girder of the wing root
Bolt hole for 1 ~ 10 monitoring site, full of airborne part, and on the ground and flight state signal of the prison
The survey, a total of 27 group to get the data.
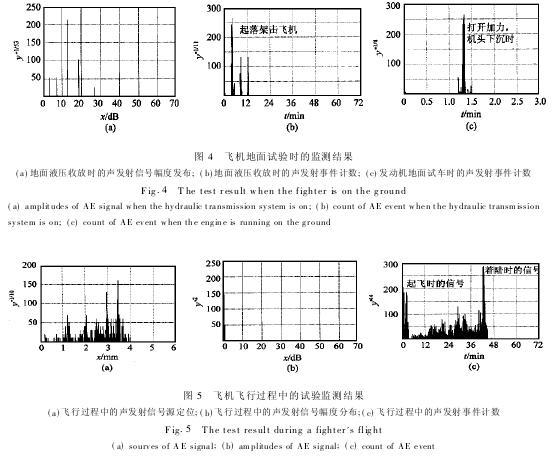
Ground test data show that the aircraft electric, hydraulic and release engine run all did not make the wing deformation, in addition to the release of the wings have impact, full head sank a vibration signal to produce a small amount of friction, and no other signals, and the amplitude of signal is very low (less than 30 db maximum), event count rarely (as shown in figure 4). As a result, the actual monitoring can not consider the impact of these factors, only consider flying wing deformation produced by the signal.
The 3.3 flight status signal monitoring
In tower controllers, flight attendant, effectively cooperate with the pilots and ground crew, gained the flight condition monitoring area of the acoustic emission signal 9 groups, one group as shown in figure 5. Analysis found that flying in the detected signal has the following features:
(1) high count rate The count rate up to 3000 / min or more, than when the ground test of 10 ~ 500 / min almost a higher
Orders of magnitude.
(2) the low amplitude of the signal The acoustic emission signal amplitude basic flight within 15 db, and ground experiment show that the crack signal
The magnitude of the general in more than 30 db, has obvious difference.

Basic are confirmed by the analysis of these signals from the monitoring area of bolt hole friction noise, this is due to the aerodynamic and airframe vibration in the flying wing root deformation repeatedly, so that the bolt with a large number of signals generated by friction between the bolt holes.
For further analysis, take constant c1 for 109, constant c2 is 103, amplitude threshold Ql is 6 db, according to the type (2), (3), for all of the data processing, the calculation results as shown in table 3.
All the data for the noise signal, the average density of 7.928, the standard deviation was 0.255; The ratio of the average of 4.262, standard
Difference of 0.160. According to the type (8), (9), standard normal distribution table to table 4.
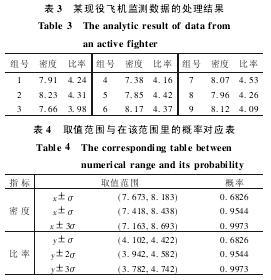
Thus, criterion of the damage can be concluded that: in a monitoring cycle, if the calculation of the large signal density greater than 8.693, the ratio is greater than 4.742, can be thought of structural damage has happened in the area of the monitoring system, should be checked. This criterion is suitable for the application of the corresponding parts of the system of the aircraft flight monitoring.
4 conclusion
Through the above analysis, we can draw the following conclusion:
(1) used in this paper, the model of the acoustic emission signal of mathematical statistics analysis, can determine acoustic emission source noise or risk of crack defects;
(2) the acquisition flight condition monitoring for the practical difficulties, the paper come, only get 9 sets of data;
(3) the paper concluded that the damage criterion is reliable and feasible in theory, can be used in practice, but in a plane did flight, flight
State of damage criterion has not been verified;
(4) to improve the acoustic emission technology discriminant accuracy of real_time monitoring the body structure, general damage criterion, should study a higher sensitivity, acoustic emission monitoring system and application of neural networks and signal processing techniques such as to strengthen the analysis and research of acoustic emission signals.
References (abbreviated)


 Blog
Blog